Is your bonus in line with market expectations? View our 2019 functional breakdown
3/19/2019 The Pay Index
Have you just received your bonus?
With over 22,200 global senior executive compensation profiles, The Pay Index is well-positioned to provide one of the most current and detailed viewpoints on all aspects of executive pay, and our statistics show that almost 75% have received (or are about to receive) your annual bonus.
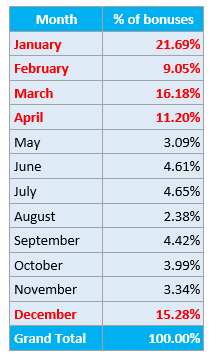
As you can see from the chart below, the period between December and April absolutely dominates the annual cycle, with 73.4% of bonuses being awarded within just a few months.
This in-turn acts as a catalyst for kicking off one the most popular periods for moving roles throughout the year, as our article on The Pay Index explored last month.
Yet, what makes up a good bonus?
Most executives we speak to start by comparing this year’s figure to what they received last year… mainly because it is incredibly difficult to obtain this kind of information from a broader peer-group.
As a result, this makes it very difficult to understand what ‘good’ actually looks like!
So, to help with this, we have delved into the compensation breakdown that we see, via The Pay Index, to provide executives with a clear picture of how base, cash bonus and deferred bonus (reflected as a percentage breakdown) differs between functions.
What is the market average for base, cash bonus and deferred bonus?
Let’s get straight to what you want to see by showing how each function is broken down, on a global basis, in terms of base salary, annual cash bonus and deferred stock / conditional bonuses – just click on the image below to view a large version:
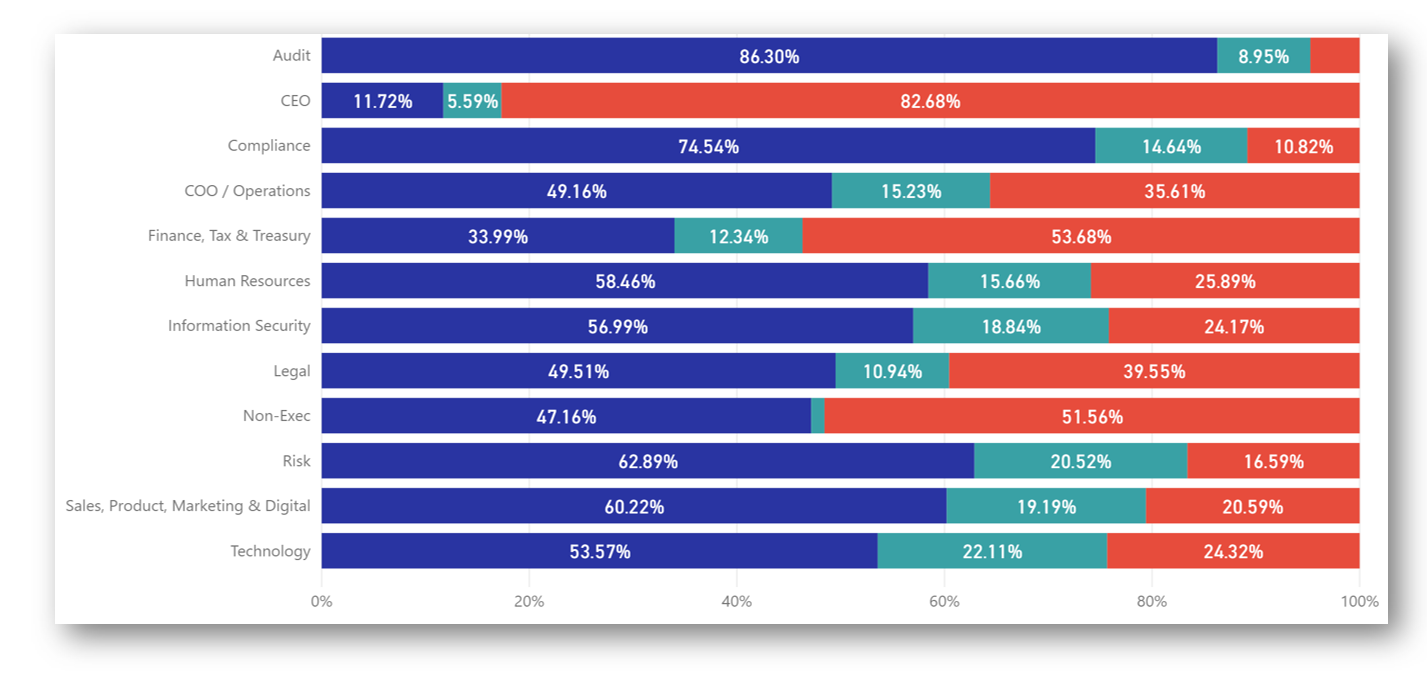
It’s probably no surprise that the CEO community has the largest deferred bonus weighting, alongside the Non-Exec community, but putting those two groups aside, the remainder of the groups will undoubtedly provide you with a much clearer insight into what is ‘the norm’ for your function.
Can I learn more about how compensation is broken down in my function?
Absolutely! The Pay Index is an independent analytics platform that you can use to accurately verify you comp package against your global peer group – completely FREE.
Register in minutes to gain access to a range of fully-interactive dashboards where you can cross-reference your compensation against company size, location, industry, education, tenure, experience and much more.
Executives who use The Pay Index frequently comment on how the data provides them with an invaluable insight when going into their pay reviews or when they are considering a new opportunity.
Click HERE or on the image below to register:

The data:
- Average total compensation is $1.04m / £824k
- Data taken from over 22,200 global senior executives
- 37% of the database work within companies of 10,000+
- 88% of the database possess a Bachelors and / or Masters Degree
- 92% of the database possess 16 or more years in industry
- 780 different cities
- 103 different countries