How did your bonus rank?
6/3/2019 The Pay Index
Bonus envy unveiled…
With over 22,500 senior executive compensation profiles globally, The Pay Index is your go-to source for the most current and detailed analysis of all aspects of executive pay. As our statistics show, almost all of you have now received your annual bonus…the wait game is over.
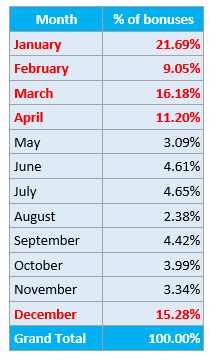
In fact, the period between December and April absolutely dominates the annual cycle with 73.4% of bonuses being awarded within just a few months.
Subsequently, with bonus season done and dusted, so begins the busy period of people looking to move roles. As per our article in February, statistics show that if you have remained in your current role for over three years, there is every possibility that your compensation has fallen behind the market average, sometimes by as much as 38%.
But let’s be frank – what really makes up a good bonus?
As humans, we are hard-wired for curiosity and while most executives can easily compare this year’s figure to what they received last year, what they really want to know is how these compare to a broader peer-group. The highly sought-after data that benchmarks your comp package in the ever-changing marketplace, both within your sector and beyond, is the key to understanding what ‘great’ really looks like!
So, to help combat exactly this, we have delved into the compensation breakdown we see on The Pay Index, to provide executives (you!) with a clear picture of how base, cash bonus and deferred bonus (reflected as a percentage breakdown) differs between functions.
What is the market average for base, cash bonus and deferred bonus?
Let’s cut to the chase by showing how each function is broken down on a global basis, in terms of base salary, annual cash bonus and deferred stock / conditional bonuses – just click on the image below to view a large version:
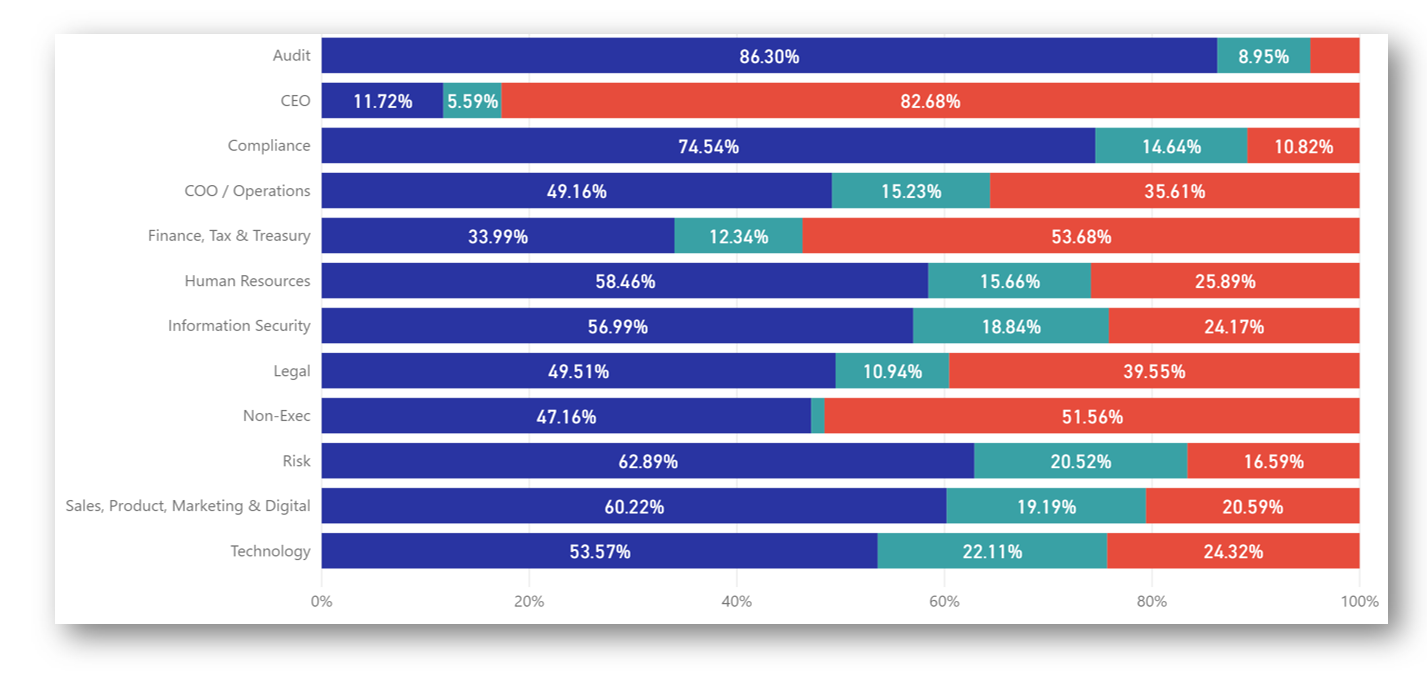
It’s probably no surprise that the CEO community has the largest deferred bonus weighting, alongside the Non-Exec community, but putting those two groups aside, the remainder of the groups will undoubtedly provide you with a much clearer insight into what constitutes ‘the norm’ for your function.
Can I learn more about how compensation is broken down in my function specifically?
You sure can! The Pay Index is an independent analytics platform that you can use to accurately verify you comp package against your global peer group – completely FREE.
Register in minutes to gain access to a range of fully interactive dashboards where you can cross-reference your compensation against company size, location, industry, education, tenure, experience and much more.
Executives who use The Pay Index frequently comment on how powerful the data is in arming them with valuable insights ahead of pay reviews or more importantly, when they are considering a new opportunity.
Click HERE or on the image below to register:

The data:
- Average total compensation is $1.04m / £824k
- Data taken from over 22,500 global senior executives
- 37% of the database work within companies of 10,000+
- 88% of the database possess a Bachelors and / or Masters Degree
- 92% of the database possess 16 or more years in industry
- 780 different cities
- 103 different countries